Early 2014 UK flooding made more likely by climate change

Weather pattern responsible is getting a boost from warming climate.

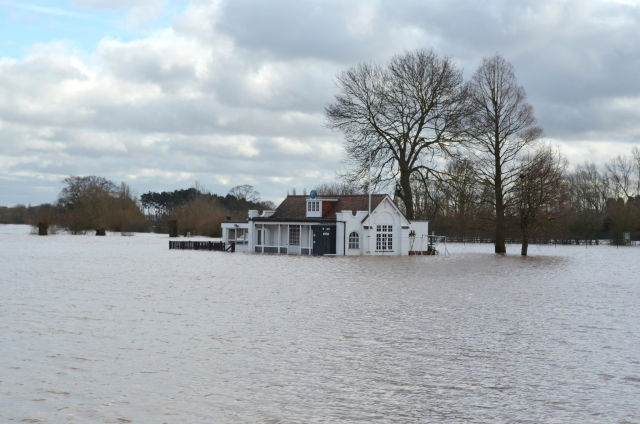
(credit: flickr user Nick)

In places like California, researchers have been working to understand how climate change is affecting droughts. But in the UK, it’s unusually wet weather making headlines of late. Southern England and Wales got soaked over the winter that ran into January 2014, leading to near-historic flooding. This led to a natural question: did climate change have a hand in it?

Climate is basically the statistics of weather, so the way we answer this is to use climate models to look for a change in those statistics. We can’t necessarily convict climate change for any particular weather disaster, but we can learn whether we should expect to see that disaster more often than we would in the absence of climate change. A home run hitter on steroids is a common analogy—they'd clearly hit some out of the park anyway, but not with the same frequency.

Good statistics require a lot of samples, so to look at the English flooding, a climate model was used to generate over 130,000 simulations of weather in the region. To do the computational heavy lifting, the team (led by University of Oxford researcher Nathalie Schaller) relied on weather@home running on volunteers’ computers. Some of the simulations were run with greenhouse gas concentrations, Arctic sea ice extent, and sea surface temperatures to match the 2013/2014 winter. The other simulations were run under approximated pre-industrial conditions: lower greenhouse gas concentrations, cooler sea surface temperatures, and the largest sea ice extent available from the satellite era (1986/1987).

Read 6 remaining paragraphs | Comments

House Science Committee takes up climate change again

Focus on why we shouldn’t do anything about it, but science takes beating, too.

Invited witnesses prepare to testify about climate science and the Paris agreement.

Tuesday saw yet another congressional science committee hearing on the topic of climate change. At least the topic of this hearing, convened by House Committee on Science, Space, and Technology Chair Lamar Smith (R-Texas), was ostensibly focused on policy rather than arguing the science. The title was “Paris Climate Promise: A Bad Deal for America.” Of course, climate science still took some shots along the way.

Rep. Smith opened the hearing with what would be a recurring theme: the Paris agreement will damage the economy without much climate benefit. But Smith couldn’t resist bringing up his ongoing feud with the National Oceanic and Atmospheric Administration (NOAA). He said:

An example of how this administration promotes its suspect climate agenda can be seen at the National Oceanographic [sic] and Atmospheric Administration. Its employees altered historical climate data to get politically correct results in an attempt to disprove the eighteen year lack of global temperature increases.

NOAA conveniently issued its news release that promotes this report just as the administration announced its extensive climate change regulations. NOAA has refused to explain its findings and provide documents to this Committee and the American people. The people have a right to see the data, evaluate it, and know the motivations behind this study.

Here's a quick review: There’s no evidence that NOAA scientists did anything but their jobs, there is no eighteen-year lack of global temperature increases, the update to NOAA’s dataset had been in the works for years, NOAA provided Smith with personal explanations of how the work was done and why, all the data has been publicly available all along, and NOAA has provided him with the e-mails between staff (but not scientists) he demanded.

Read 10 remaining paragraphs | Comments

An equation that debunks conspiracy theories

OK, not really. But for real: don’t believe silly conspiracy theories.

How deep does the rabbit hole go? (credit: Aurich and Eva Lawson)

For some, rejection of the human role in climate change reduces to a conspiracy: the world’s climate scientists are part of a socialist cabal falsifying research to justify energy regulations. Someone who has never met a climate scientist or looked closely at published studies can simply hold onto this idea rather than deal with the mountain of scientific evidence. Of course, it is patently ridiculous. The conspiracy would include an incredible number of scientists around the world, perfectly coordinating for decades, with nary a leak to give the game away—and that's before getting into all the socialists who would have to be involved.

In a recent paper, Oxford physicist and cancer researcher David Robert Grimes decided to try to create a mathematical measure for just how stupidly implausible that idea is—a sort of conspiracy probability equation. (Isn’t that exactly the kind of thing the cabal would use to throw the sheeple off the scent? Grimes must be in on it!)

The equation calculates the probability of a conspiracy-busting leak as 1-e-tφ, where φ includes the (potentially changing) number of conspirators over time and the odds that one of those people leaks information in a given year. To estimate the odds that your average conspirator spills the beans, Grimes turned to some historical examples of events fitting the academic definition of “conspiracy”: the NSA’s PRISM program, the Tuskegee syphilis experiment, and the FBI’s shoddy forensics uncovered by Frederic Whitehurst in the late 1990s.

Read 7 remaining paragraphs | Comments

Half the ocean’s warming has come in the last couple decades

Study takes a new look at heat energy added to the oceans since 1865.

(credit: Jeffrey)

Over 90 percent of the heat energy added to Earth’s climate system by human activities has gone into the ocean, in part because, well, it's awfully big.

That awful-bigness makes monitoring all that heat energy a real challenge. A new study led by Peter Gleckler and Paul Durack at Lawrence Livermore National Laboratory compiled as much data as possible and compared it to climate model simulations. The comparison not only shows that the ocean's warming can only be explained by human impacts (surprise!) but also highlights just how quickly global warming is occurring outside of our view.

Although a large number of automated floats have been measuring temperatures in the upper 2,000 meters of the ocean for over a decade now, ship-based measurements from the past are more sparse. And the deeper the water, the fewer the available measurements. Because of this, studies analyzing the cause of ocean temperature changes have mainly stuck to the upper 700 meters. For this study, the researchers pulled together some more data—including the Challenger Expedition from the 1870s—in order to make deep ocean comparisons more worthwhile.

Read 8 remaining paragraphs | Comments

Why was most of the Earth’s coal made all at once?

It wasn’t because fungi couldn’t break down early trees, study argues.

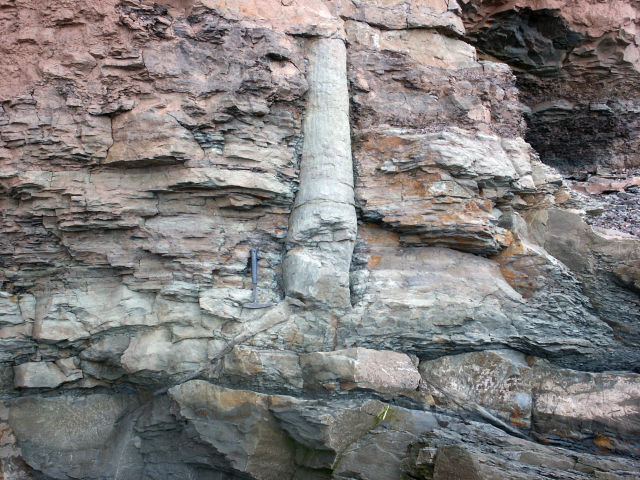
A fossilized lycopsid—a tree-sized relative of club moss—buried by Carboniferous sediment. (credit: Wikimedia)

It made for a neat story:

Question: Why did so much of the world’s coal form during the geologic period we now call the Carboniferous?

Answer: Large tree-like plants evolved before fungi evolved the ability to break down the fibrous lignin that helped give the plants structure. With nothing to make them decay, their remains were free to pile up and yield thick coal deposits.

It’s a neat story, but, a new study led by Stanford’s Matthew Nelsen argues, it’s not true.

While coal deposits formed both before and after the Carboniferous, this period provided the mother lode. It occurred a bit over 300 million years ago and was a funky time that saw relatives of club mosses grow to the size of trees while insects also reached comparatively gigantic proportions due to the higher-than-modern oxygen concentration.

Read 11 remaining paragraphs | Comments

Thorough, not thoroughly fabricated: The truth about global temperature data

How thermometer and satellite data is adjusted and why it must be done.

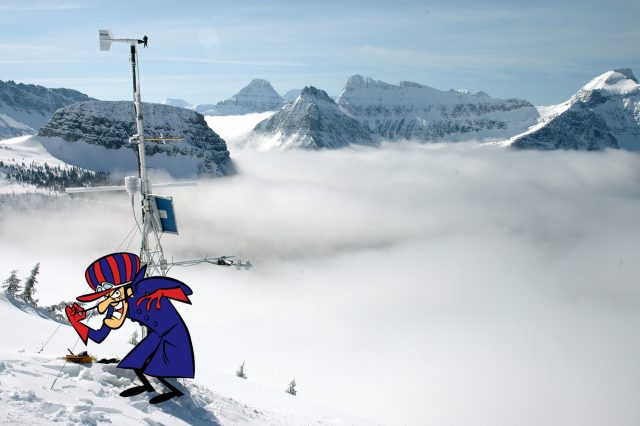
(credit: Scott K. Johnson/Suzanna Soileau-USGS/Hanna-Barbera)

“In June, NOAA employees altered temperature data to get politically correct results.”

At least, that's what Congressman Lamar Smith (R-Tex.) alleged in a Washington Post letter to the editor last November. The op-ed was part of Smith's months-long campaign against NOAA climate scientists. Specifically, Smith was unhappy after an update to NOAA’s global surface temperature dataset slightly increased the short-term warming trend since 1998. And being a man of action, Smith proceeded to give an anti-climate change stump speech at the Heartland Institute conference, request access to NOAA's data (which was already publicly available), and subpoena NOAA scientists for their e-mails.

Smith isn't the only politician who questions NOAA's results and integrity. During a recent hearing of the Senate Subcommittee on Space, Science, and Competitiveness, Senator Ted Cruz (R-Tex.) leveled similar accusations against the entire scientific endeavor of tracking Earth’s temperature.

Read 64 remaining paragraphs | Comments

2015 was official the hottest year on record

Beating 2014, it was the first year to hit 1°C above levels of the late 1800s.

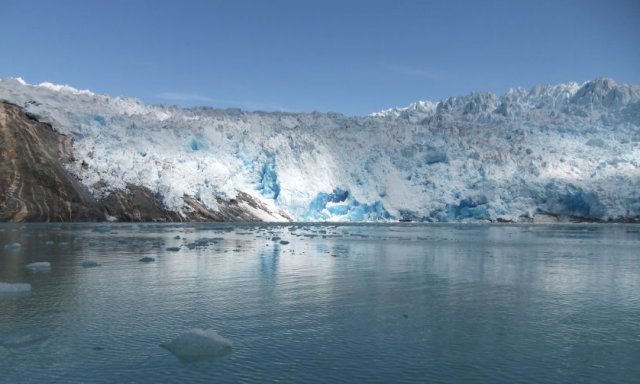
Outlet glacier Hoffellsjökull as seen in Vatnajökulsþjóðgarður National Park in southeast Iceland. Due to climate change, Hoffellsjökull glacier has retreated a considerable distance and a deep glacial lake is rapidly developing in the depression left behind. (credit: Cheryl Strahl)

As record months piled up, it became clear a while ago that 2015 was going to be the hottest year on record. Now the final numbers are coming in—and like the official times from a race between me and Usain Bolt, they’re hardly a surprise.

Just as La Niñas hold down the global average temperature because of the cool ocean water rising to the surface in the eastern equatorial Pacific, El Niño conversely pushed the average temperature up. And 2015 saw a doozy of an El Niño that rivaled the monsters of 1997 and 1982. As the long-term trend of global warming continues, El Niño years are likely to be your record-setters.

The US saw the second-warmest year on record for the Lower 48 (2012 is still tops), and the third wettest year as Oklahoma and Texas set records. California, however, had its 13th-driest year, with the promise of El Niño rains yet to deliver. The UK had its sixth-wettest year on record, but not quite as warm—15 years have been warmer.

Read 4 remaining paragraphs | Comments

We narrowly missed a new ice age, and now we won’t see one for a long time

Before fossil fuels rendered this moot, conditions were nearly right.

Enlarge (credit: Kelsey Winsor)

Recorded human history has played out within one type of climate—an interglacial period. During the glacial periods of the last million years (commonly referred to as “ice ages”), great ice sheets grew to cover Canada and some points south, as well as Northern Europe and much of Russia.

In the 1970s, we learned there was a consistent 100,000-year heartbeat to this back-and-forth cycle governed by subtle patterns in Earth’s orbit. The thing is, it’s about time for the next heartbeat. We’re at the part of the cycle where the interglacial period should be wrapping up and the slow but inexorable descent into another ice age would begin.

But that hasn’t happened, and it’s not going to any time soon. Our current breakneck emissions of greenhouse gases will see to that. Still, the scientific question is worth asking: what, exactly, does it take to start off an ice age?

Read 8 remaining paragraphs | Comments

Seismometers detect underground atomic bomb test in North Korea

Country claims it was a hydrogen bomb, but it was no larger than previous tests.

(credit: (stephan))

Just last week we had occasion to mention that seismometers are used to detect secret nuclear weapons tests as well as earthquakes. (That mention came in a story about seismometers detecting munitions explosions during fighting in Baghdad in 2006.) This week, we’ve seen this detection in action.

Around 8:30pm EST Tuesday, seismometers around the world detected what appears to be an underground detonation of an atomic bomb in North Korea. The event, which was equivalent to about a magnitude 5.1 earthquake, occurred at a shallow depth in the same location as previous tests in 2006, 2009, and 2013—a region that doesn’t see many earthquakes.

The seismic signals of these explosions differ from those produced by earthquakes. Earthquakes release compressional waves as well as shear waves produced by the sliding motion along a fault. Those waves travel through the body of the Earth, arriving at slightly different times. The real damage in an earthquake comes from waves that travel along the surface of the Earth and are the last to arrive.

Read 3 remaining paragraphs | Comments

How much do greenhouse gas emissions warm your part of the world?

New map shows how climate sensitivity varies around the globe.

Climate science attempts to answer a lot of questions, but Earth’s population probably cares about just one of them: what is the amount of global warming we should expect from a given amount of greenhouse gas emissions?

There are a variety of metrics researchers use to describe that variable, differing mainly in how long you give the climate system to equilibrate. One handy metric is called the “transient climate response to cumulative carbon emissions”—TCRE for short. Given a total amount of CO2 emitted up until a point in time, this relationship tells you about how much warming will have already occurred.

It’s a straightforward and (nearly) linear relationship that was highlighted in the last Intergovernmental Panel on Climate Change report. Find your place on the graph by totaling up historical CO2 emissions and you get an idea of how much of the “carbon budget” remains before you reach, say, 2°C warming.

Read 9 remaining paragraphs | Comments