A recipe for global cooling—put seafloor on dry land near the equator

Tectonic plate collisions could explain 40 million years of climatic history.

Oceanic crust sometimes ends up on land—like the Ingalls Peak area in Washington. This stuff pulls carbon dioxide out of the atmosphere as it weathers. (credit: brookpeterson)

Earth’s climate has stayed within a pretty narrow range of temperatures over its history if you compare it to the inhospitable heat and cold found elsewhere in our Solar System. This relative stability has been maintained by an intricate system of interactions. On geologic timescales, the chemical commerce between the atmosphere and the rock of Earth’s crust acts as a thermostat. The weathering of common minerals includes a reaction that removes CO2 from the atmosphere. High temperatures (caused by higher CO2) mean faster weathering, which gradually brings CO2 and temperature back down. It’s a moderating influence.

But plate tectonics also fiddle with the dial on that thermostat. Arcs of volcanoes along subduction zones (where one plate dives beneath the other) provide a constant source of CO2, and subduction zones come and go over time. Research using tough zircon crystals as records of volcanic arcs has found a correlation with climate over geologic time. In fact, a new study published this week in Science extends that comparison over the last 720 million years by finding evidence that volcanic activity rises and falls with the great swings in Earth’s climate.

A second study—published in the Proceedings of the National Academy of Sciences and led by MIT’s Oliver Jagoutz—looks at the flip side of the equation: the ability of plate tectonics to strengthen the weathering feedback that eats CO2. Although climate change can increase or decrease the rate of weathering, the amount of exposed and easily weatherable rock makes a huge difference. The igneous rocks that make up oceanic crust, for example, make excellent CO2 sponges—or at least they would, if they weren’t at the bottom of the sea.

Read 9 remaining paragraphs | Comments

Coral are bleaching along the entire Great Barrier Reef

Warm water is causing the most damaging event we’ve ever seen there.

(credit: Dorothea Bender-Champ for ARC Centre of Excellence for Coral Reef Studies)

Coral reefs are about as colorful as the ocean gets—except when they bleach. Overly warm water can cause corals to spit out the colorful, photosynthetic, single-celled symbiotes that live inside them and produce most of their food. If the heat passes before the corals starve to death, their symbiotes can return, bringing color and health back to the coral.

As the globe warms, widespread bleaching events are occurring with disturbing frequency. These tend to occur during times of El Niño conditions in the Pacific, which add a temporary boost to the warming water at some reefs. The current record-strength El Niño is sadly no exception.

Researchers contributing to Australia’s National Coral Bleaching Taskforce recently completed a survey of the state of the iconic Great Barrier Reef. The results show that it is currently experiencing the worst bleaching event we’ve ever seen there. Overall, 93 percent of the Great Barrier Reef has bleached to some degree. The northern half of the reef has been hit the hardest, with about 80 percent categorized as severely bleached. The far southern portion has escaped the warmest water, and the area of severe damage there drops to around 1 percent.

Read 1 remaining paragraphs | Comments

Guilds of trees share their sugar

Trees of different species are caught sharing carbon via fungal symbiotes.

(credit: Oona Räisänen)

We use many words to describe groups of trees: forest, wood, grove, stand, copse… But what about “guild”? (Don’t worry, neither druids nor dryads are about to be invoked.) Woven into the roots of forest trees are mycorrhizae, fungi that are close partners with the trees. The fungi help free up nutrients from the soil, and the trees hook the fungi up with some sugar for their trouble.

Researchers have found that mycorrhizae can actually bind trees into a community by facilitating the transfer of nutrients among them. And experiments with saplings have even shown that sugar can be traded via the “myconet.” Individual trees have always been viewed as separate organisms that compete for light and water, but now it appears that real forests may collaborate in secret ways below ground.

A group of researchers including Tamir Klein, Rolf Siegwolf, and Christian Körner took advantage of a unique experimental setup In a Swiss forest. There, a construction crane houses a carbon dioxide source that runs to five 40-meter-tall Norway spruce trees, where thin porous tubes tied to the branches slowly leak CO2 for the trees to breathe in.

Read 10 remaining paragraphs | Comments

Ex-EPA scientist publishes Wyoming fracking study that agency abandoned

Study stands by initial finding of contamination.

The view near Pavillion, Wyoming. (credit: EPA)

In late 2011, the Environmental Protection Agency published a draft report on an investigation of groundwater contamination near Pavillion, Wyoming, where fracking had jump-started an oil and natural gas field that includes the Wind River Reservation. It's an unusual geologic setting, with little separation between the drinking water aquifer and the rocks being fracked for gas. Add poorly sealed gas wells, the draft report concluded, and you get fracking contamination that appeared to have reached the drinking water aquifer.

Controversy ensued, and the EPA withdrew from the investigation before the report was ever finalized, giving the state of Wyoming control.

One of the EPA scientists leading the investigation, Dominic DiGiulio, subsequently took a job at Stanford University. Along with Stanford colleague Rob Jackson, DiGiulio has tabulated all the EPA data that was sitting in scientific limbo—DiGiulio even went as far as using a Freedom of Information Act request to access EPA data from a couple of water samples that weren’t published.

Read 13 remaining paragraphs | Comments

New model shows Antarctica alone could raise sea level a meter by 2100

And they keep going up for centuries, possibly reaching 12 meters.

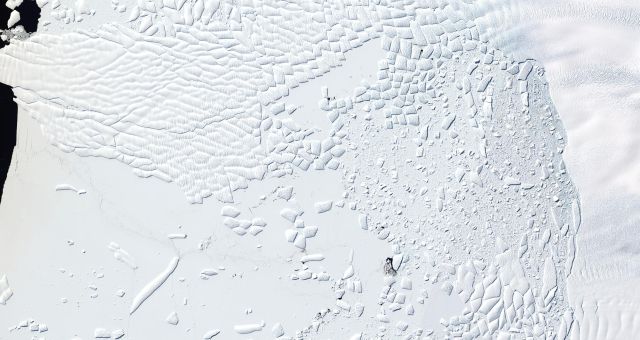
Enlarge / Satellite imagery of the seaward edge of Thwaites Glacier in Antarctica. Thwaites Glacier accounts for a big chunk of the West Antarctic Ice Sheet, and it's vulnerable to major retreat. (credit: Knut Christianson)

It’s obvious that a warming climate will mean less glacial ice and higher sea level, but putting a precise number on these things is another matter. The landscapes concealed beneath the great ice sheets of Greenland and Antarctica are complex in hugely important ways. The interplay of ocean currents, which deliver warmer water to eat away at the underside of floating ice shelves, also varies regionally and even locally. And the ice itself is a dynamic thing, flowing in response to changes at the coastal edges.

So while we use measurements in the present and records from the past to forecast the future, we're stuck with scientific uncertainty, which means we need the language of risk analysis to discuss things sensibly. What is the possible range of sea level rise? And what are the probabilities for different parts of this range?

While some work in this regard has already been done, we're continually sharpening those assessments. As data and knowledge accumulate, our models of the ice sheets become more reliable guides to the future.

Read 9 remaining paragraphs | Comments

The Moon’s ice deposits suggest it has had a wobbly past

Polar ice deposits suggest the Moon’s axis shifted in the past.

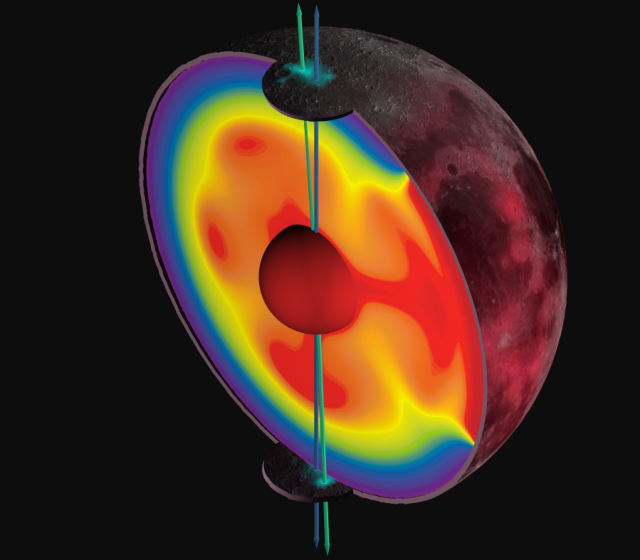
The blue line is the Moon's present axis of rotation, but there's evidence that it used to rotate around the green line—the hot, red portion of the Moon in the right of the image could be responsible for the shift. (credit: James Tuttle Keane)

Billions of years ago, the Moon would have looked larger in the sky, as it has very gradually drifted away from the Earth over time. But in addition to its apparent size changing, the face of our companion satellite has probably tilted a smidgen.

That’s the conclusion of a new study from a group led by Matthew Siegler, Richard Miller, and James Keane, who based their analysis on some old data. In 1998, the Lunar Prospector mission was launched to map, among other things, deposits of water ice expected to exist at the Moon’s poles. Because the Moon’s axis of rotation is nearly perpendicular to the plane of its path around the Sun, it has no seasons, so the ever-dark bottoms of craters at the poles are fiercely cold. With temperatures that cold, any water ice that found its way there could be protected from turning to gas and escaping to space.

But instead of being restricted to a small circle at extreme latitudes, there’s an errant bulge of ice at both poles. If you draw a straight line through the center of the Moon—about six degrees off from its axis—you can connect the two bulges. Was that line once the Moon’s axis of rotation?

Read 7 remaining paragraphs | Comments

Monarch butterflies could disappear from Eastern US within 20 years

As population declines, the prognosis is not encouraging.

(credit: Sandy/Chuck Harris)

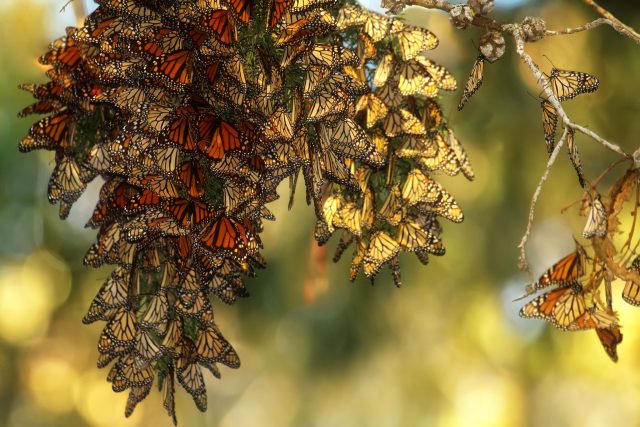
In colder climes, signs of spring can lift a heavy weight from a tired, frozen spirit. Trees bud, flowers bloom, and migratory species trickle in to announce the approach of summer. In the US, one of those species is a floppy orange gem: the monarch butterfly. These insects winter in amazingly dense clusters in Mexican forests before making a staggeringly long journey (one that spans multiple generations, in fact) to summer homes to the north.

But in recent years, the population of monarchs that stay east of the Rockies has dropped like a rock. Precise population numbers are difficult to come by, but estimates kept by the US Fish and Wildlife Service show about an 80 percent decline over the last decade.

Unfortunately, it appears that humans are responsible. The life cycle of the monarch is tightly linked with the milkweed plant. Females lay almost all of their eggs on these plants, and the larvae happily munch on them when they hatch. Milkweed tends to pop up in areas where the soil has been disturbed, like farm fields.

Read 9 remaining paragraphs | Comments

Early results from New Horizons’ rendezvous with Pluto

We’ve seen the pictures, so what have we been looking at?

Enlarge / The dwarf planet Pluto (colors enhanced to show differences). (credit: NASA/JHUAPL/SwRI)

When the New Horizons spacecraft sent back its first images of Pluto in July, the view was glorious and extraordinary. It’s not every day that we get to see a (dwarf) planet up close for the first time. As planetary scientists scrambled to put the pieces of their blown minds back together, we got some initial observations and hypotheses about Pluto’s surprising surface. But the bulk of the data from New Horizons’ brief encounter had yet to be transmitted back to Earth. As that data continues to stream in, more detailed science is being done.

This week in Science, a stack of five papers lays the foundation for that science by describing Pluto’s geology and atmosphere, as well as that of Charon and the smaller satellites orbiting the dwarf planet with the big heart.

That includes a basic description of the Plutonian landscape—at least the hemisphere that greeted the New Horizons spacecraft on approach. The lower quality data from the other side will eventually be analyzed as well.

Read 12 remaining paragraphs | Comments

Population trends in the US put more at risk of sea level rise

Accounting for population growth can triple number of people at risk in 2100.

(credit: Alyx Dellamonica)

Some of the impacts of climate change are conceptually complex, such as weather extremes, storm tracks, and ecosystem shifts. But one impact that's easy to imagine is sea level rise. When the ocean comes up, stuff ends up underwater. So one way to project the future consequences is to simply calculate how many people and buildings are below a given height above the current sea level.

But sea level isn’t the only thing changing—so are the people and buildings. A new study led by the University of Georgia’s Mathew Hauer looks at population trends around the coastal US for a better estimate of how many people would be affected by rising ocean waters by the end of this century.

The researchers took census data from 1940 to 2010 for coastal counties, and they extrapolated the trends through 2100. Then they ran the results through two scenarios of future sea level rise: one in which it rises 0.9 meters by 2100 and one in which it increases fully 1.8 meters. Those numbers correspond to reasonable estimates if greenhouse gas emissions continue to grow unabated and show the upper end of the potential range of sea level rise.

Read 4 remaining paragraphs | Comments

Why did methane stop increasing, then start again?

New study points to a mix of human and natural causes.

Rice paddies near Bandung, Indonesia. (credit: Onny Carr)

The rise of atmospheric carbon dioxide has been unrelenting over the past century. But that isn’t the only greenhouse gas humans are adding to the atmosphere, and other have different stories to tell. Methane levels, for example, actually flattened out in the late 1990s, holding pretty steady until continuing an upward climb in 2006. Why, you ask? Well, you aren’t the only one.

Methane is a little harder to get a handle on than CO2, partly because human emissions from things like livestock, rice growing, and landfills are a little harder to track. It's also partly because the natural terms in the global equation are large and erratic. In wetlands, where water-logged, oxygen-poor sediments host methane-exhaling microbes, the amount of methane released varies strongly between wet or dry years. And then there’s the long-term warming of the Arctic, where thawing permafrost can constitute an additional methane source to account for.

Researchers try to determine trends in methane contributions in several ways. You can do your best to monitor individual processes and add up all your estimates. Or, flipping that around, you can interrogate atmospheric measurements to figure out which processes could be responsible for changes. As it happens, methane molecules come with labels that make that easier—different types of methane sources impart different isotopic fingerprints on the carbon in CH4.

Read 9 remaining paragraphs | Comments